
A quick start guide to Locrating
This blog post is intended to help new users get up and running with Locrating as quickly and easily as possible. The screenshots below show usage on a computer; all features also exist on the mobile version of the site, but may be displayed slightly differently due to the limited screen space. This article is designed to be read from top to bottom, but the links below take you directly to different sections:
Finding schools in an area of interest
Filtering schools
Showing nurseries
Comparing schools using local league tables
Shortlisting schools
Map style and transport
Saving settings and searches
Local amenities
Local crime
General settings
Last updated date
Adding a home marker and measuring distances
Neighbourhood information
Layers
School popups
- Inspection reports
- school reviews
- Exam results
- Admissions data
- Last distance offered
- Pupils' movements between schools
- Pupil details, year group sizes and pupil ethnicities
- School financials and contact details
- Recently viewed schools
Catchment indicators
Independent schools
Getting help
Finding schools in an area of interest
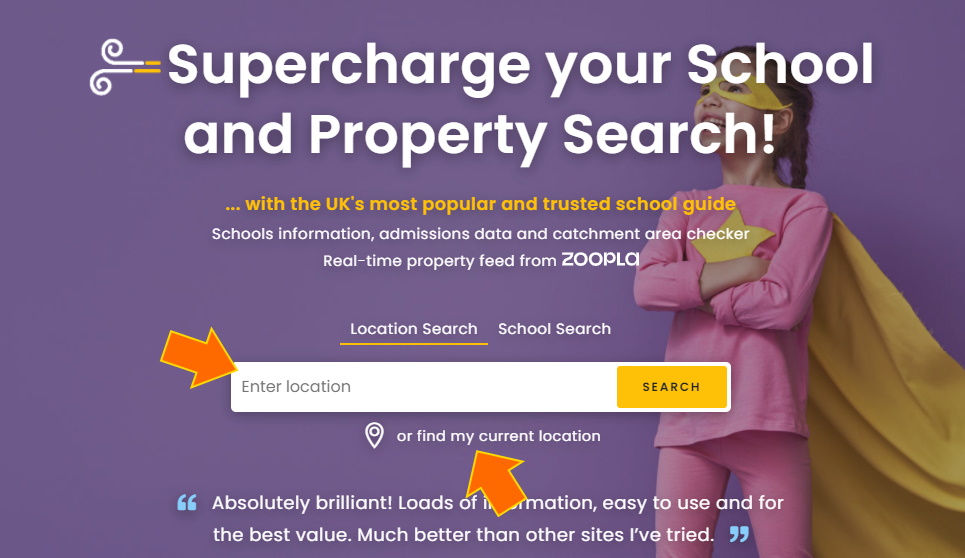
Essentially, Locrating shows schools on a map and all data and features are accessed via this map. You can navigate to the map from our home page in three different ways. You can (1) search for a location, e.g. a post code or place name, by typing into the search field and then pressing enter or the search button. You can (2) view your current location on the map by clicking "or find my current location" under the search bar ...
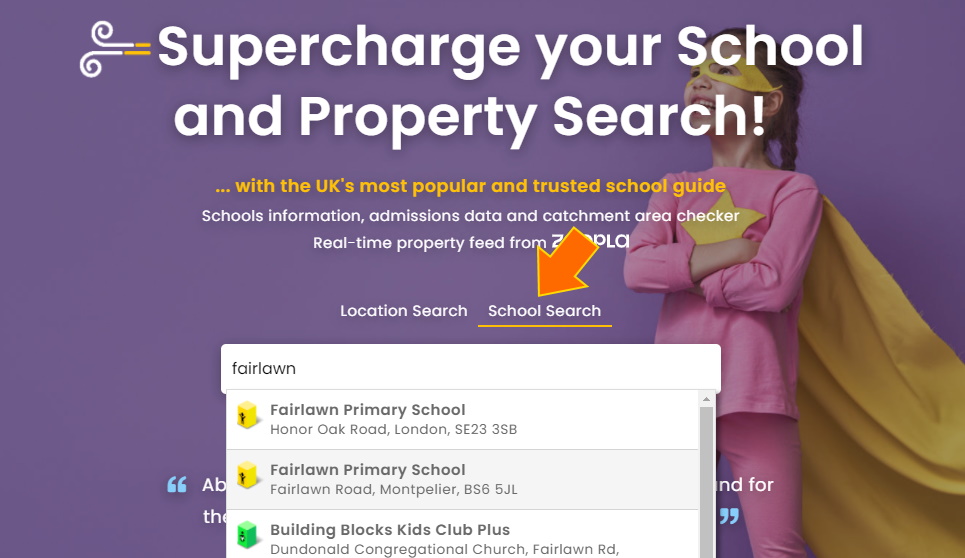
... and (3) you can search for a school (or nursery) by its name; by clicking the 'School Search' tab and typing the name of the school and then selecting it from the drop down results.
Once viewing the map, you can navigate to a different area using the search fields under the map menu. The map menu is where you access all the map features.
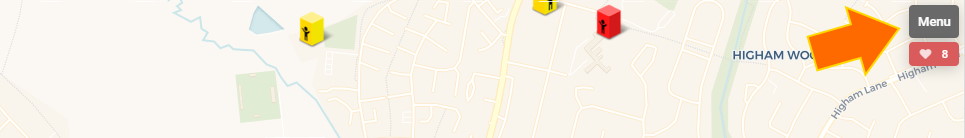
Once you open the menu you can search for an area (e.g. postcode or town name), you can go to your current location (using the purple home button), or you can search for a specific school by name.

Pressing enter submits your search and you are then taken to that area on that map with schools shown as icons on the map.
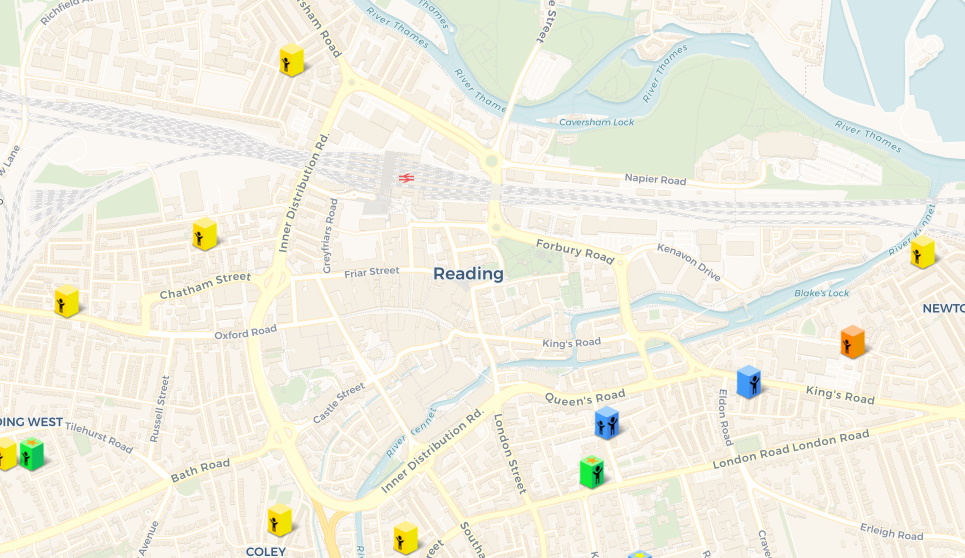
You can see what each icon represents by opening the key (the blue button in the bottom left of the map). The children in the block indicate if the school is a primary, secondary (or both), whilst the colour tells you the latest inspection rating of the school.
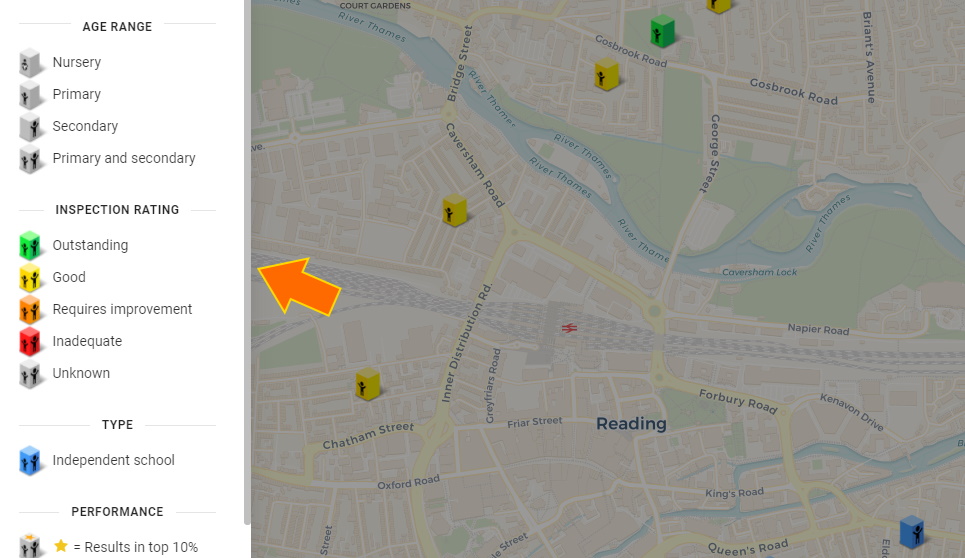
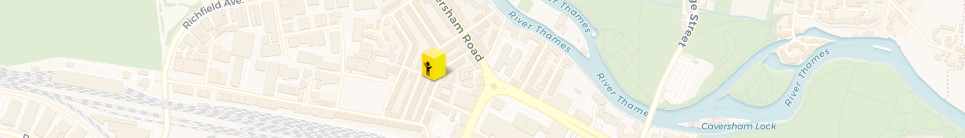
The following icon therefore is an Ofsted rated "Good" primary school:
Clicking on a marker shows information on the school, see School popups.
Filtering schools
To remove clutter, you can filter out schools that are not of interest using the school filters, for example you could choose to show only primary schools. The filters can be used to narrow down your search based on a range of factors, such as age range, inspection rating, gender, religion etc. You can also chose to include or exclude independent and/or special schools.
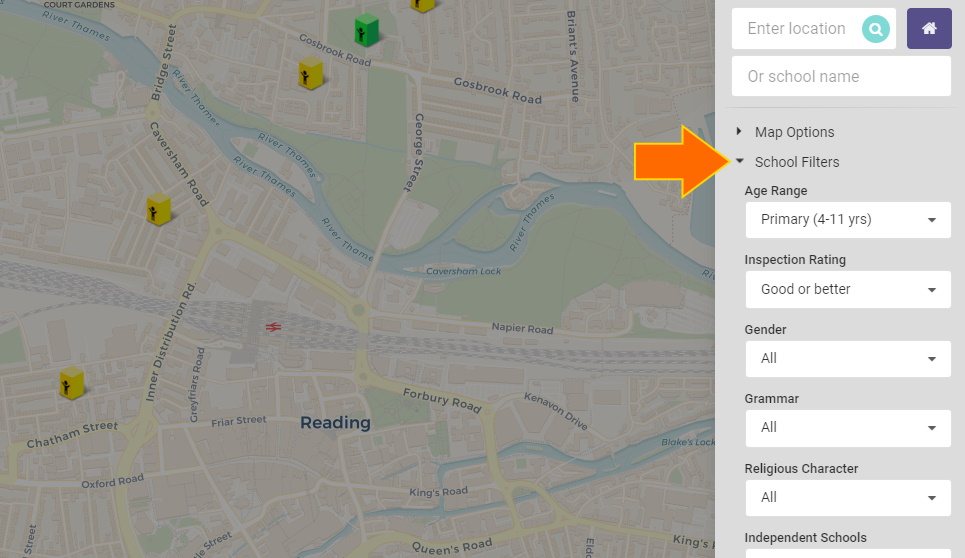
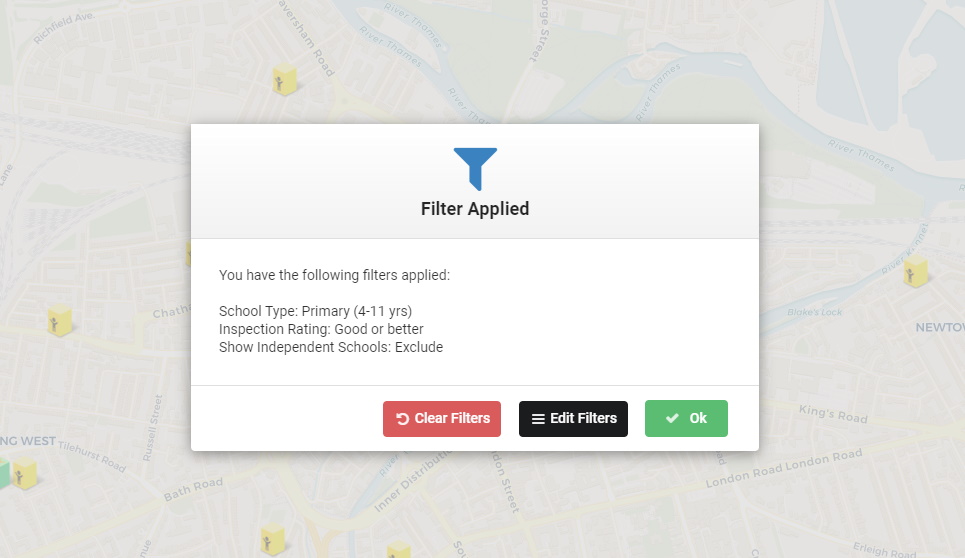
You can always tell when you have a filter applied as there is a warning indicator shown. This is warning you that not all schools may be shown as you have one or more filters turned on.
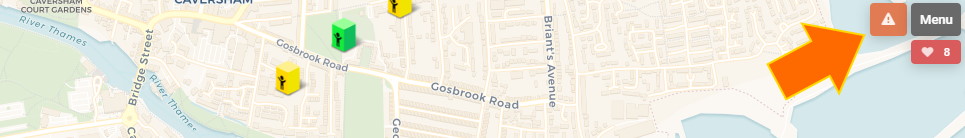
If you click the warning indicator, it will tell you all the filters applied and you can quickly clear them if you wish.
Showing nurseries
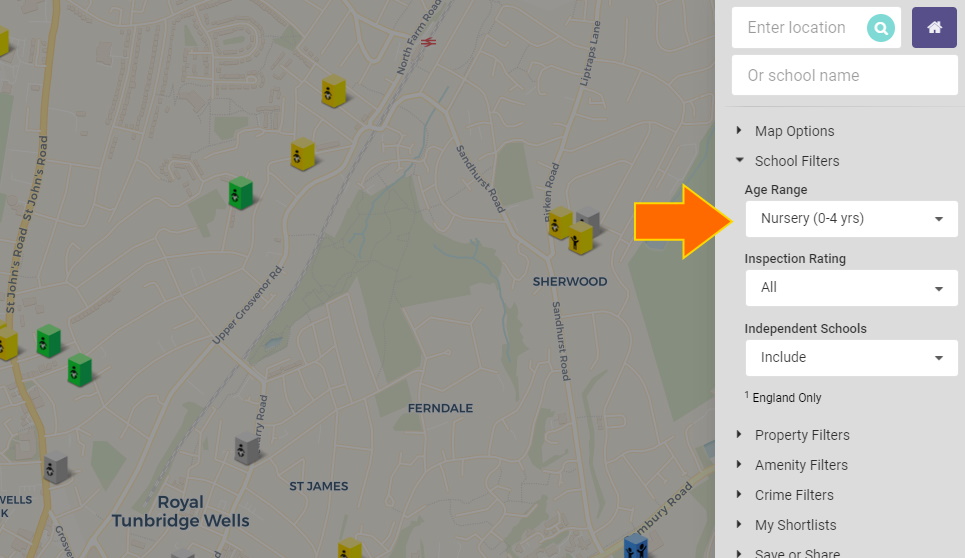
Showing both schools and nurseries on the map, at the same time, causes excessive clutter. You must therefore chose to view either schools or nurseries at any one time.
You do this by selecting the age range in the school filters. Selecting 'Nursery' causes nurseries to be shown on the map, any other option will result in schools being shown. In the case of schools that have attached nurseries, these are also shown when the 'Nursery' option is selected.
Comparing schools using local league tables
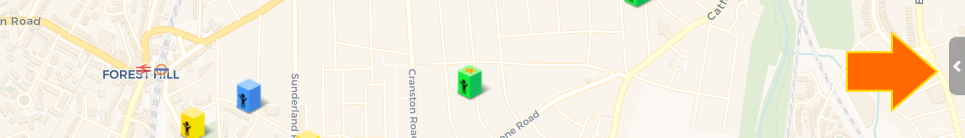
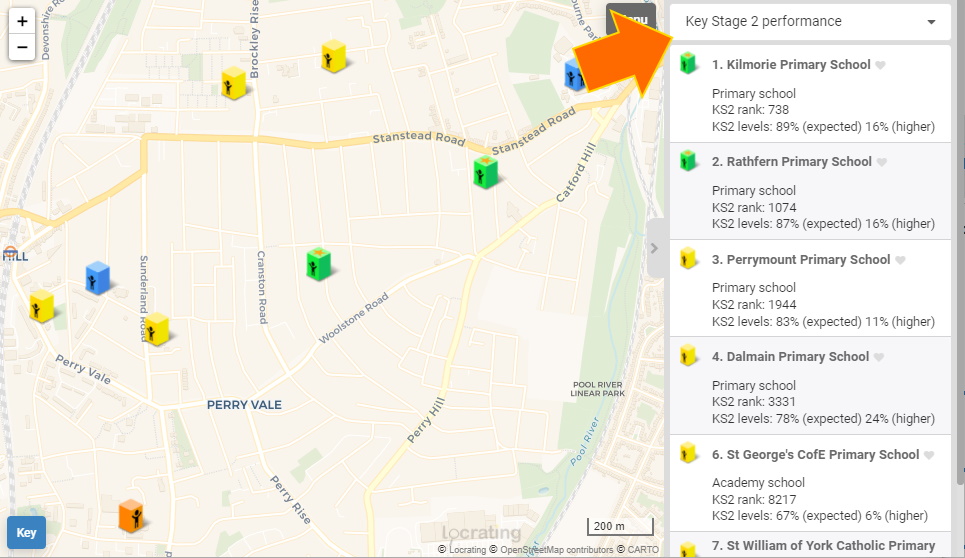
You can view the details of all the schools currently viewable on the map using the pull out side bar.
This shows all the schools on the map in a list, allowing them to be sorted by a range of measures, such as exam results, pupil progress and even fees for independent schools. To select what the schools are sorted by, use the drop down at the top of the list. This is a very powerful feature, because you can create local league tables based on all kinds of things such as progress in reading at Key Stage 2 for example. If you click a school in the list it will bounce on the map so you can see where it is.
Shortlisting schools
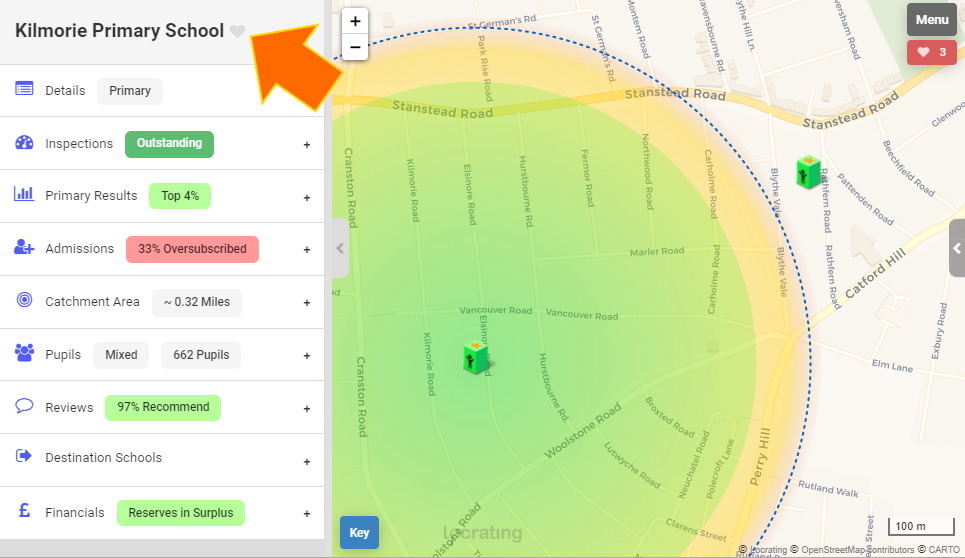
You can keep a shortlist of schools using the heart icons. These can be found in the title bars of popups.
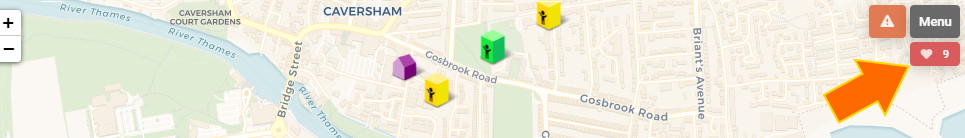
The number of items in your shortlists is shown in a red button next to the menu button. Clicking on this button will take you to the shortlists menu (or you can just open the menu using the menu button).
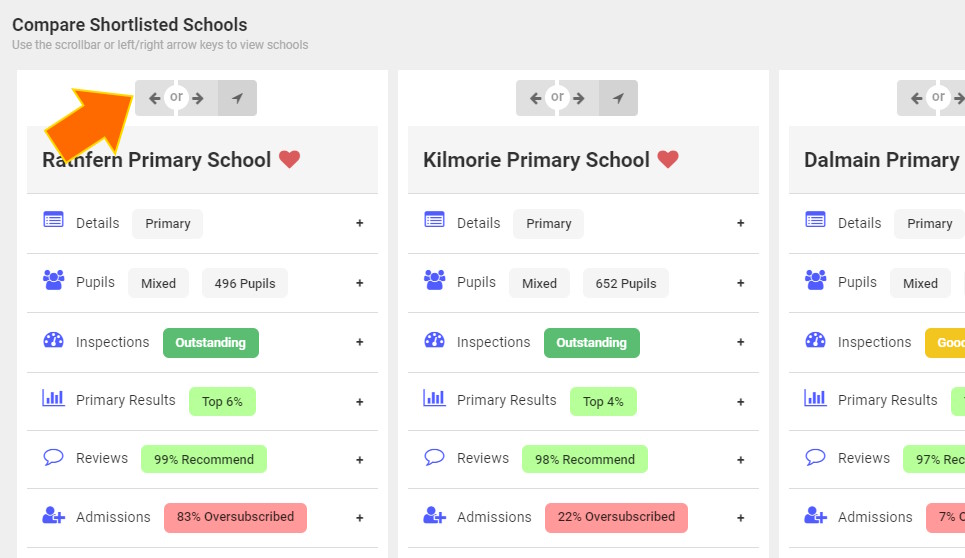
Options here allow you to clear your shortlists, only view shortisted items on the map and to view shortlisted items side by side.
When viewing items side by side you can use the left/right arrows at the top to change the order they are displayed in and the single arrow to the right to navigate to the item on the map. The open tab of all items is kept in sync for easier comparison. You can click the red heart to remove a schoolfrom your shortlist.
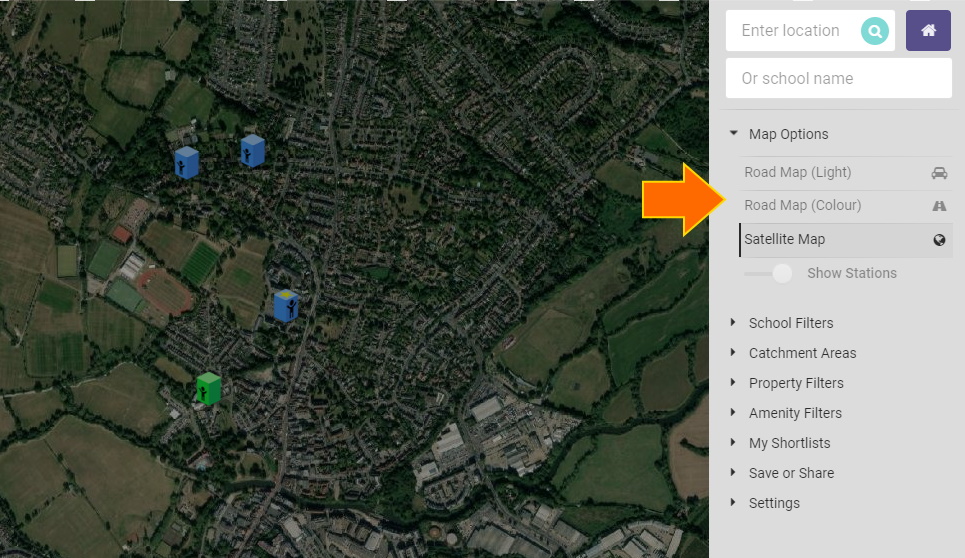
Map style and transport
You can change the map style to a greyscale, colour or satellite map via the map options. You can also choose to show or hide transport markers, such as stations.
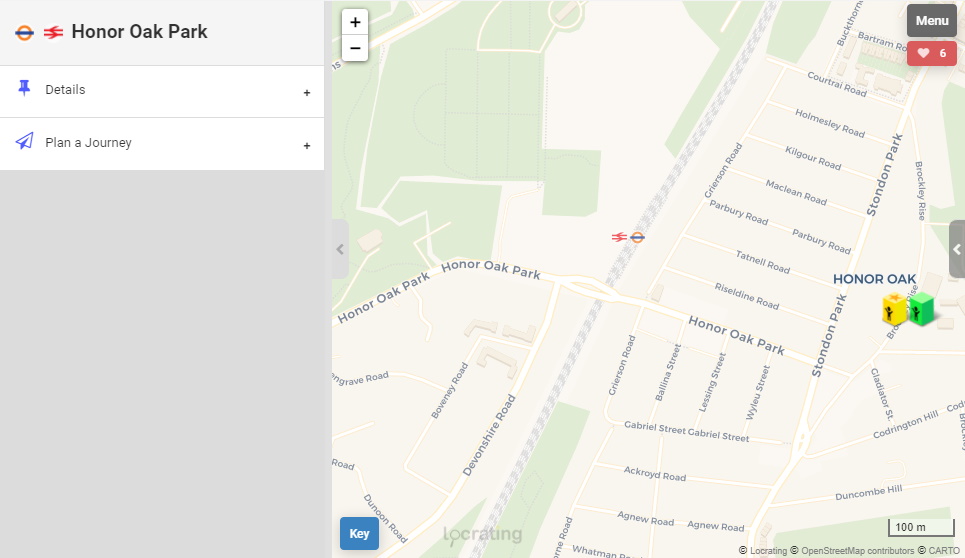
You can click on stations and other transport markers to view network maps and plan journeys.
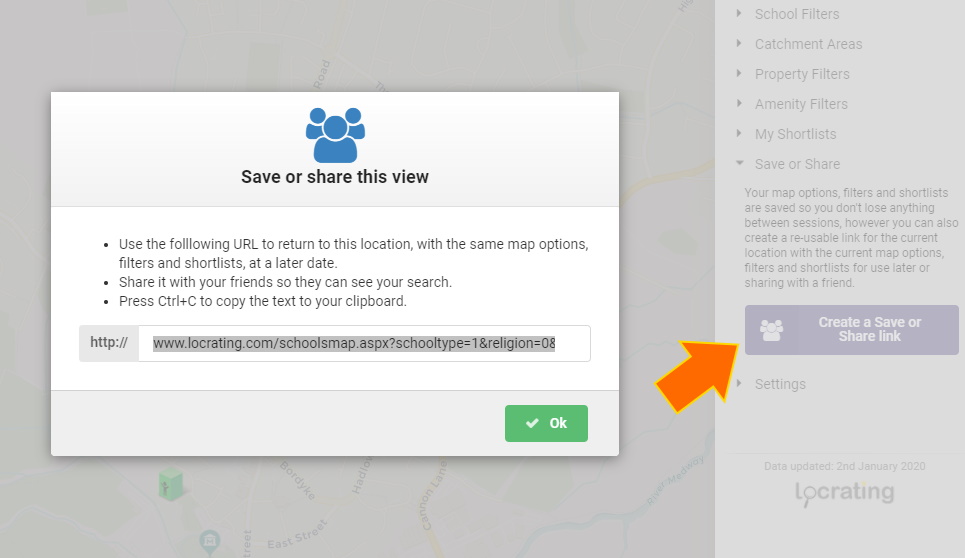
Saving settings and searches
When signed into Locrating, your settings (which include your filters, shortlists and preferences) are stored against your account so you can switch seamlessly between devices. However if you wish to save a snapshot of your settings, for use later or for sharing with a friend (who also has membership), you can create a link that contains all the settings encoded within it, which you can save and reuse at a later date; to do this use the button under the 'Save or Share' menu section.
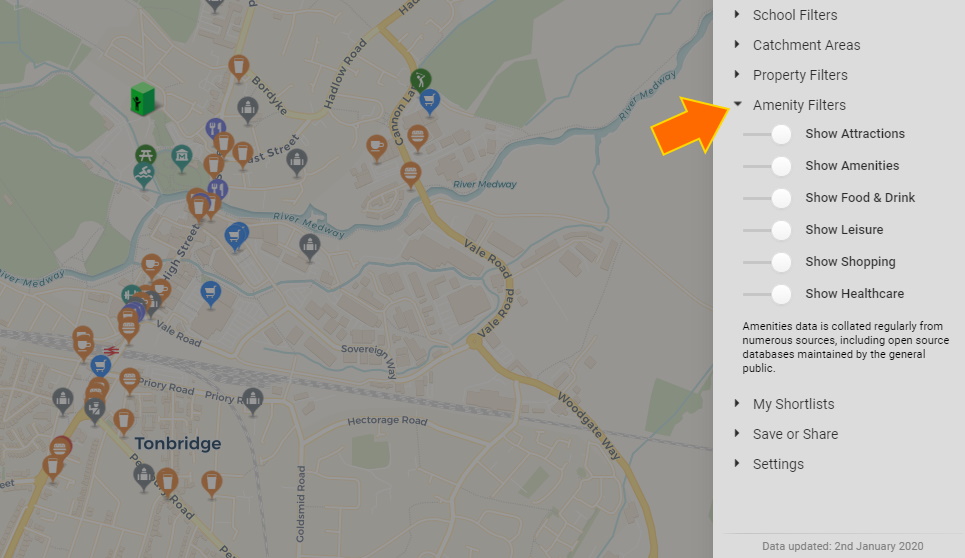
Local amenities
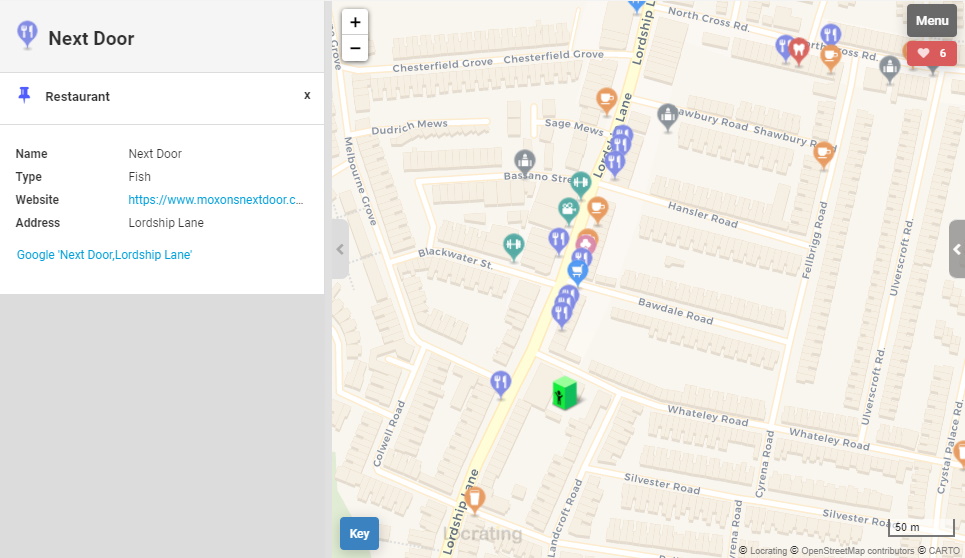
You can view local amenities, such as restaurants, shops and healthcare using the amenity filters. Different categories of amenity can be turned on and off.
Clicking on an amenity marker shows its details.
Local crime
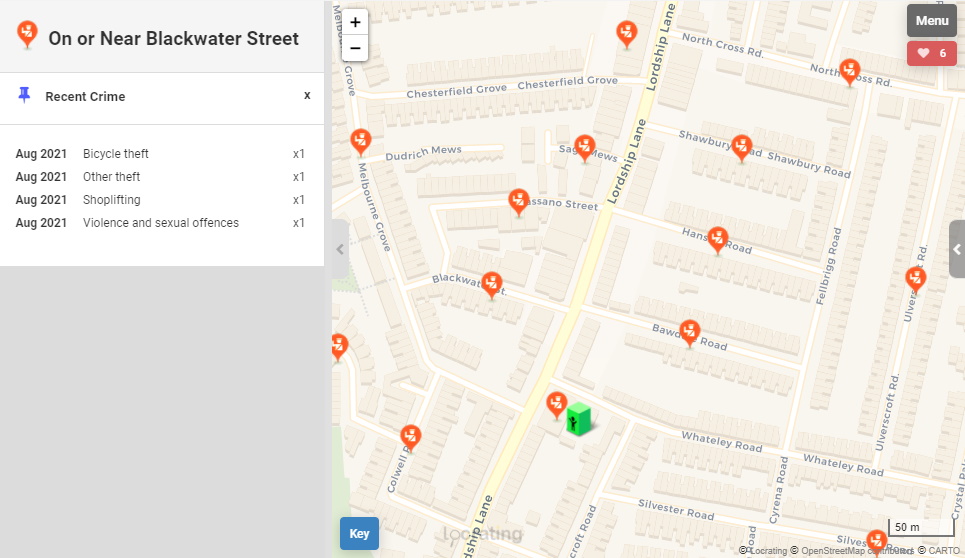
You can view local crime using the crime filters. You can chose which catergory of crime to view and also for which date period.
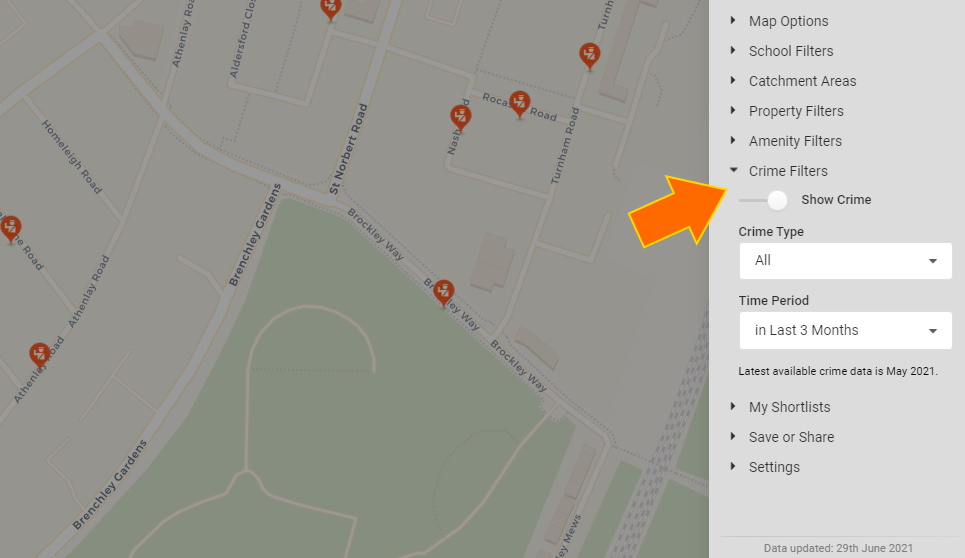
Clicking on a crime marker shows its details.
General settings
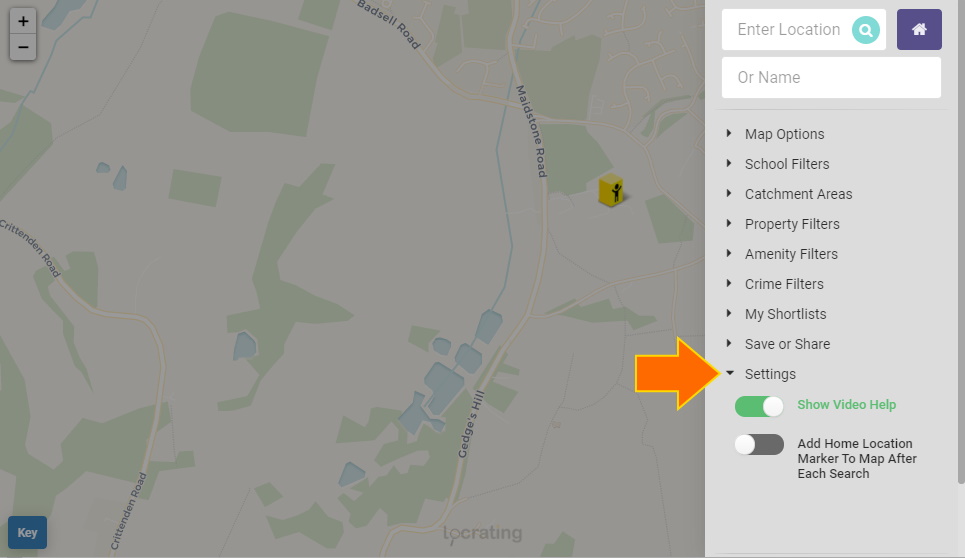
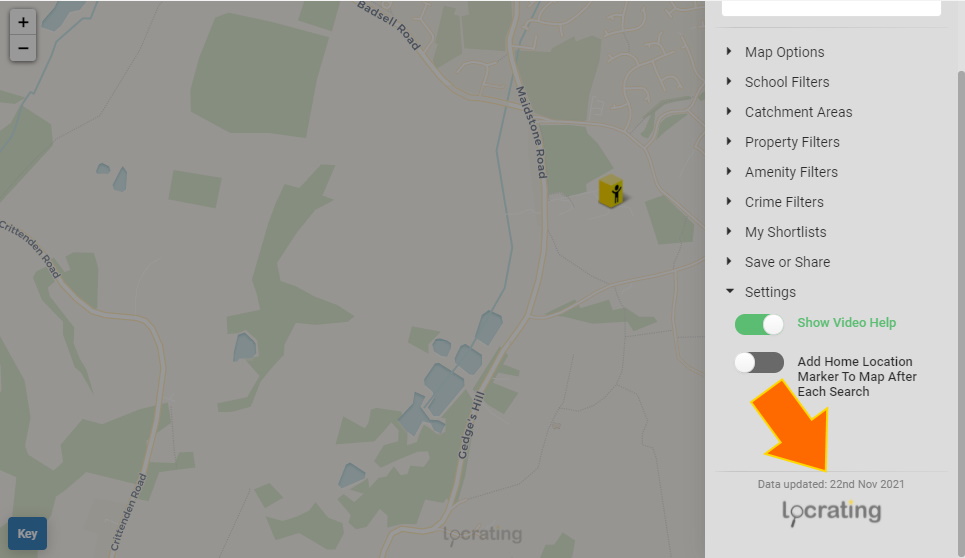
General settings are shown under the settings section of the menu. Here you can turn on/off video help and turn on other features; such as popups being launched when you hover the mouse over a marker and whether to automatically display a home location marker after each search.
Last updated date
You can see when our data was last updated by looking at the bottom of the menu. We update roughly every two weeks, but sometimes it can be a week or so longer depending on the time of the year and our workload, e.g. when schools are shut during the holidays there is usually little to no new data to obtain as they are not being inspected. When we update, we refresh all site data.
Adding a home marker and measuring distances
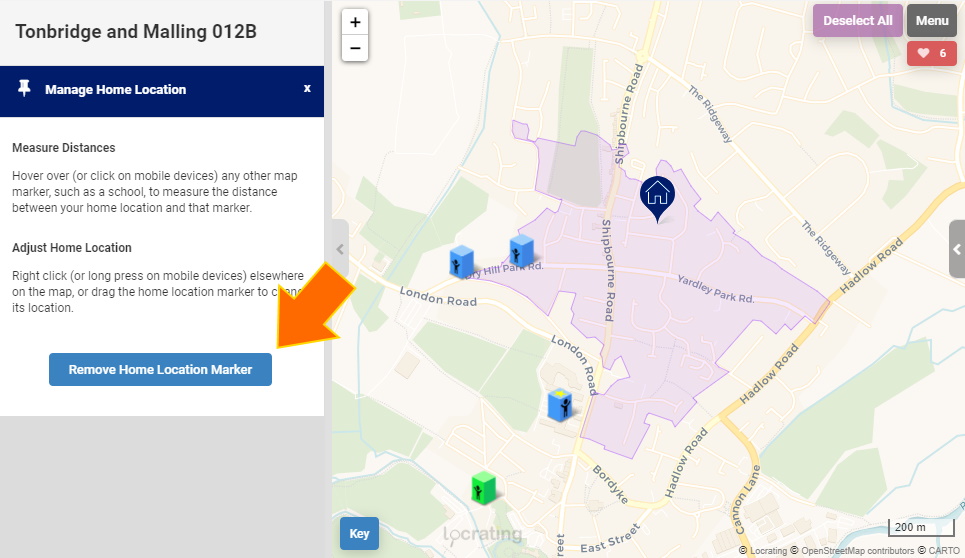
If you right click on the map (or long press on a mobile) you can add a home location marker to the map. This will allow you to measure distances between your home and schools; by simply moving the mouse over a school or clicking on a school on a mobile. You can drag the home location marker to fine tune its position.
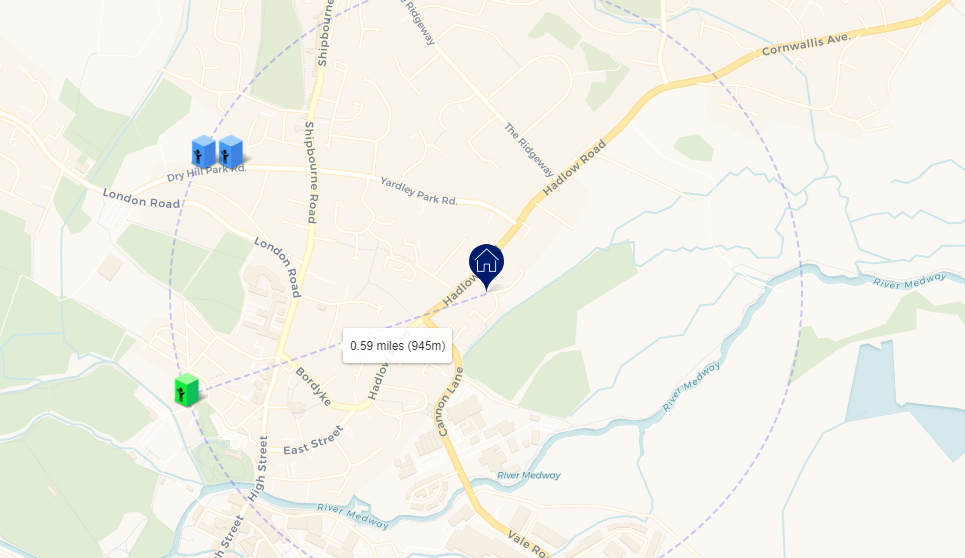
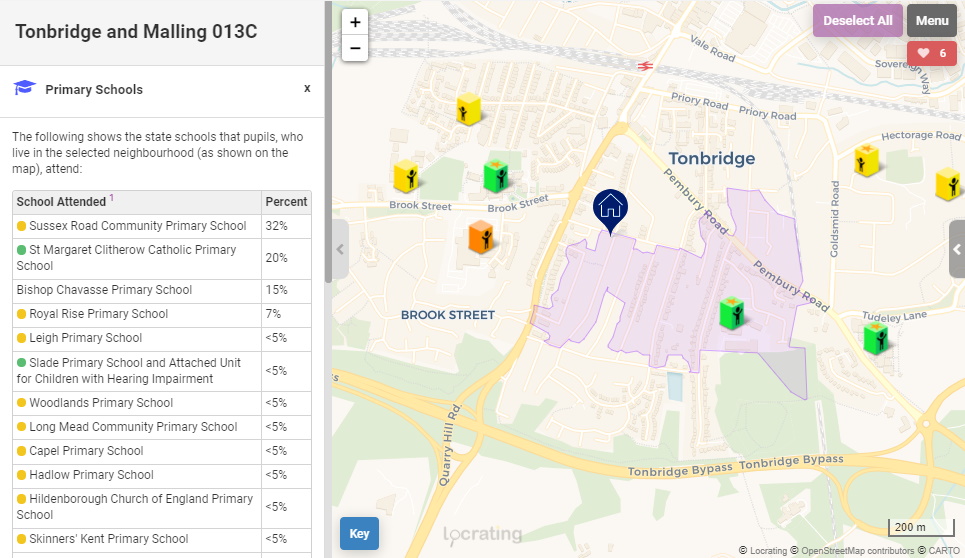
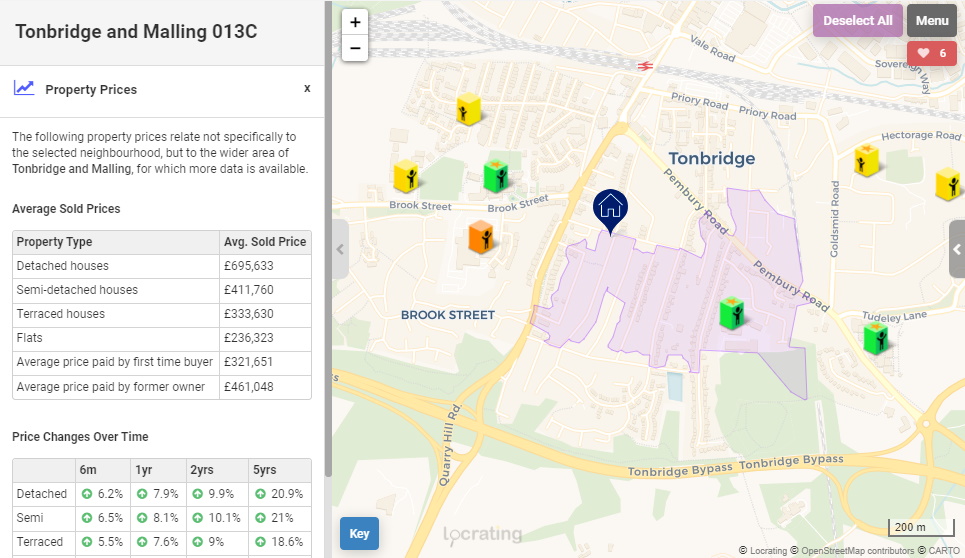
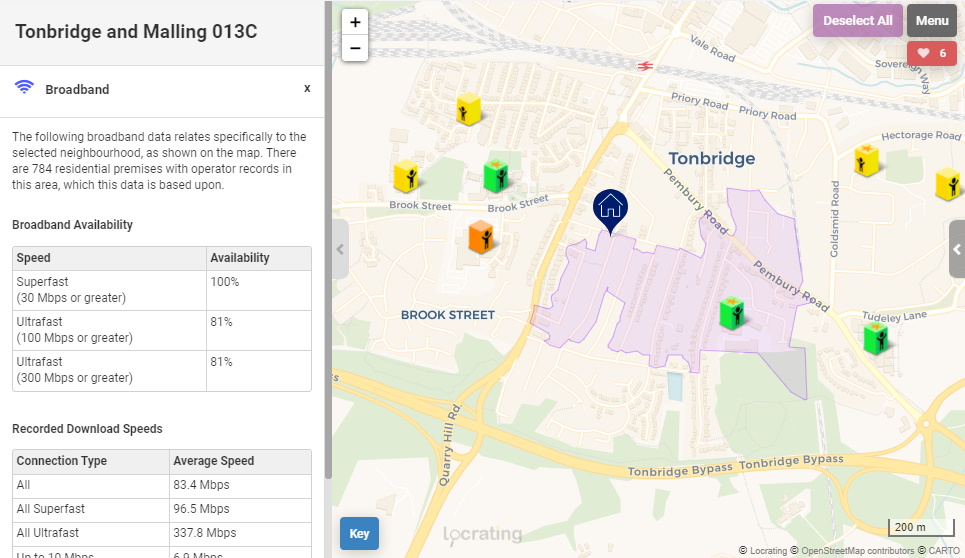
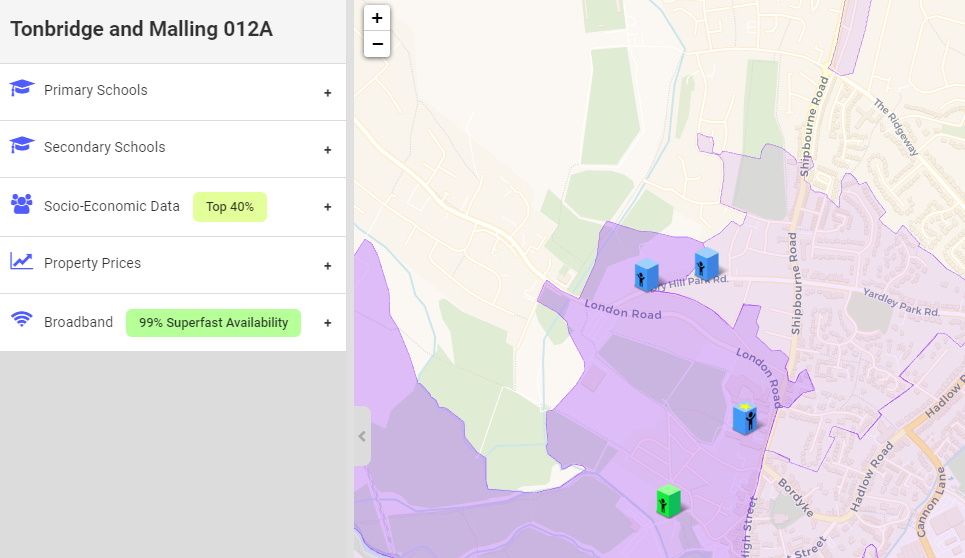
Clicking on the marker allows you to plan journeys, as well as view neighbourhood information such as socio-economic data, schools attended, historical sold prices and local broadband speeds. The purple area drawn on the map is the area that the socio-economic, schools and broadband data relates to. Property sold price data relates to a larger area as detailed in the tab.
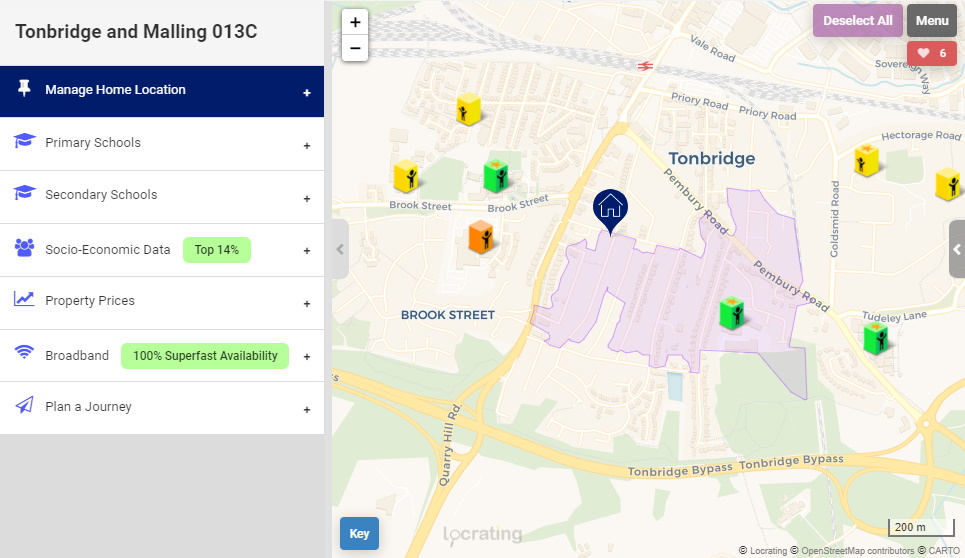
You can remove the home location marker using the button in the Manage Home Location tab.
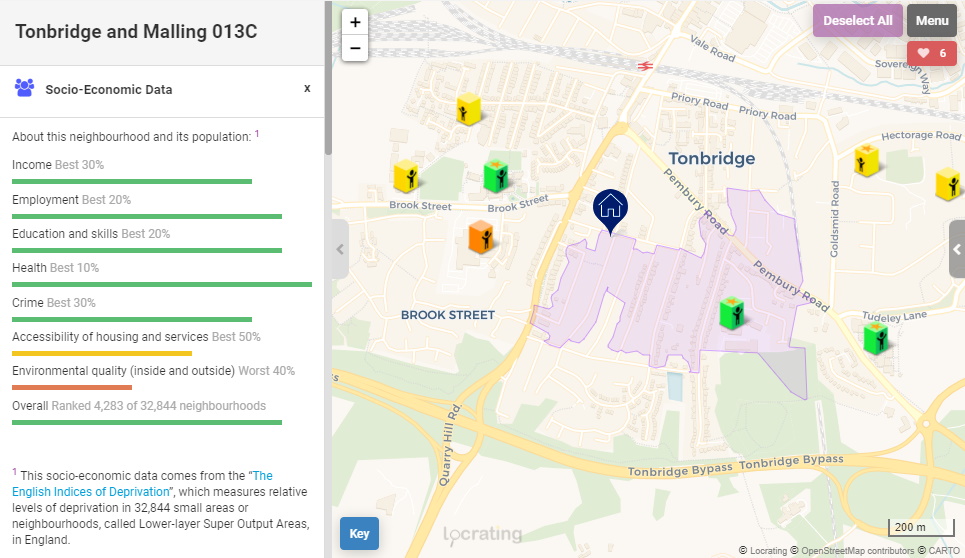
Neighbourhood information
Sometimes purple areas will be shown on the map; when you click on the home location marker for example, as described above. You can click on these purple areas and see information about the neighbourhood; such as socio-economic data, schools attended, historical sold prices and local broadband speeds. The purple area drawn on the map is the area that the socio-economic, schools and broadband data relates to. Property sold price data relates to a larger area as detailed in the tab.
Another circumstance where purple areas will be shown is when showing where existing pupils live.
With these options turned on, the purple areas are show when you click on a school.
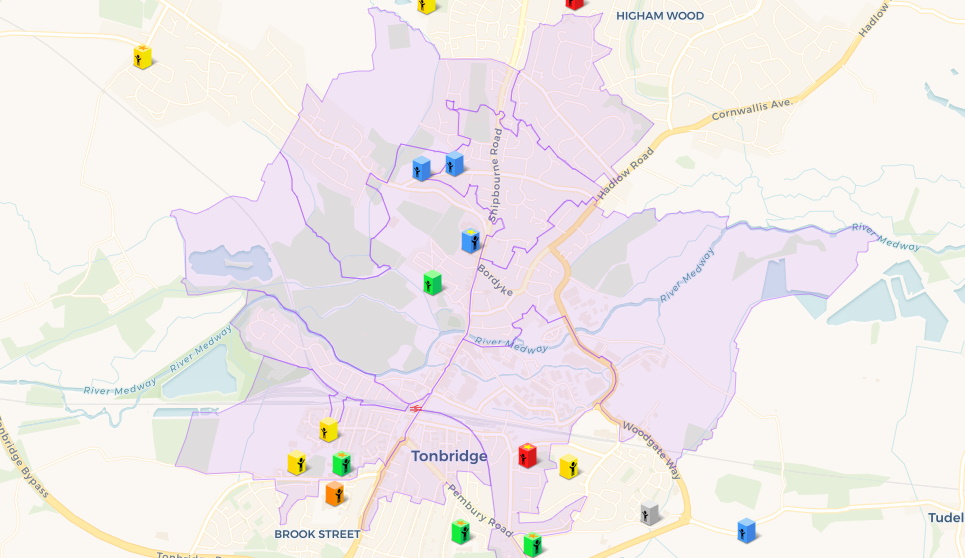
You then just click on the area to see the local information.
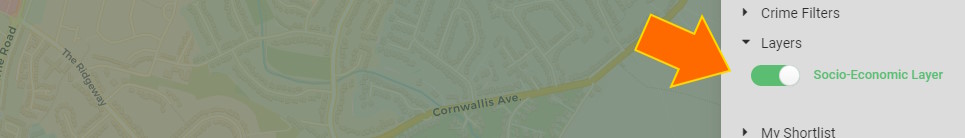
Layers
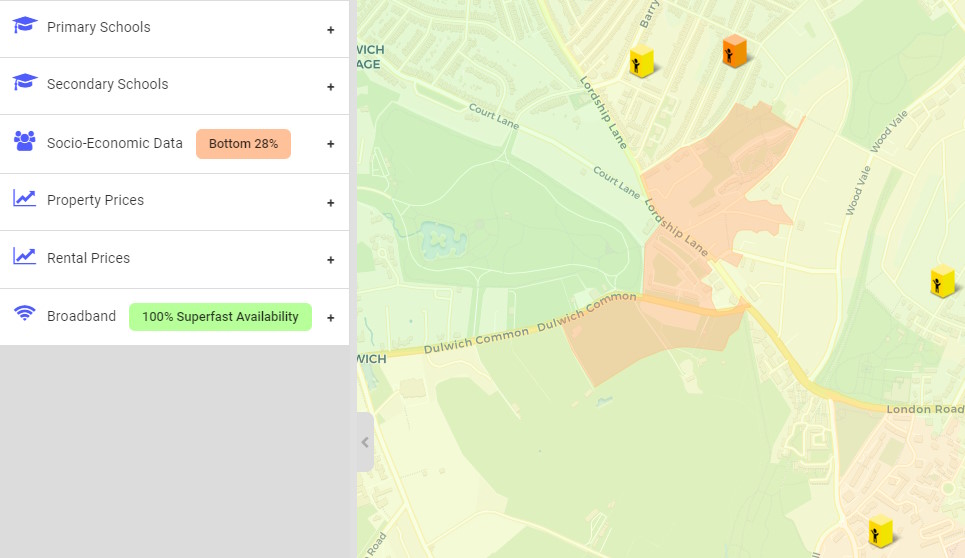
Layers allow you to overlay information on the map. The various socio-economic layers use the socio-economic data available via our neighbourhood profiles (shown above) to highlight on the map neighbourhoods and their relative ranking, based on the selected measure; e.g. the overall socio-economic layer shows each area's overall socio-economic ranking where colours range from red areas, which have high deprivation to green areas, which have low deprivation.
Other layers include measures such as income, crime, education, employment and more. In each case green represents "good", such as low crime, high income, high employment, high education etc. and red represents "poor", such as high crime, low income etc.
You can click on a shaded neighbourhood to view more information.
Layers are turned on and off via the map menu, only one layer can be turned on at a time:
School popups
When you click on a school information about the school is displayed in a popup. Depending upon the type of school and region (i.e. England, Wales, Scotland or NI) the contents of the popup is different.
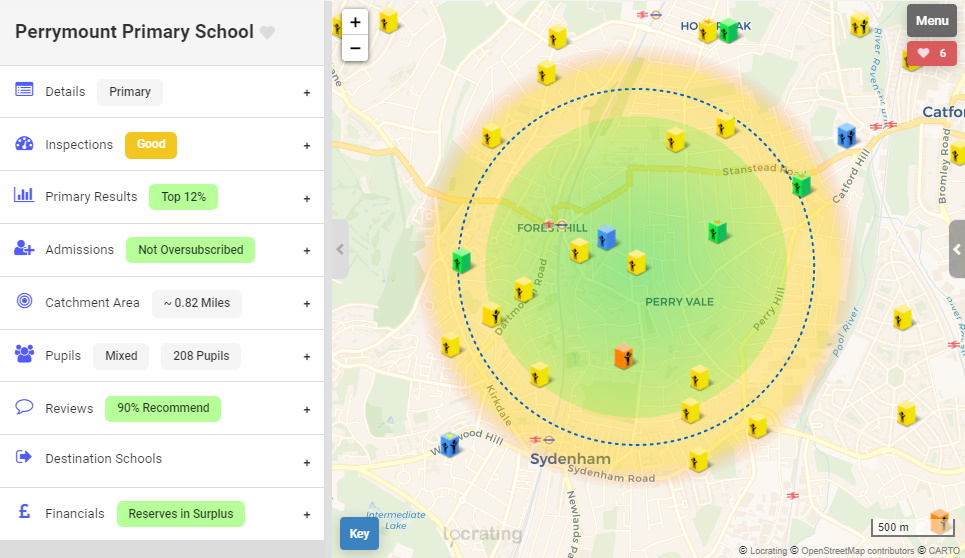
You can close the popup by clicking the tab button on its side.
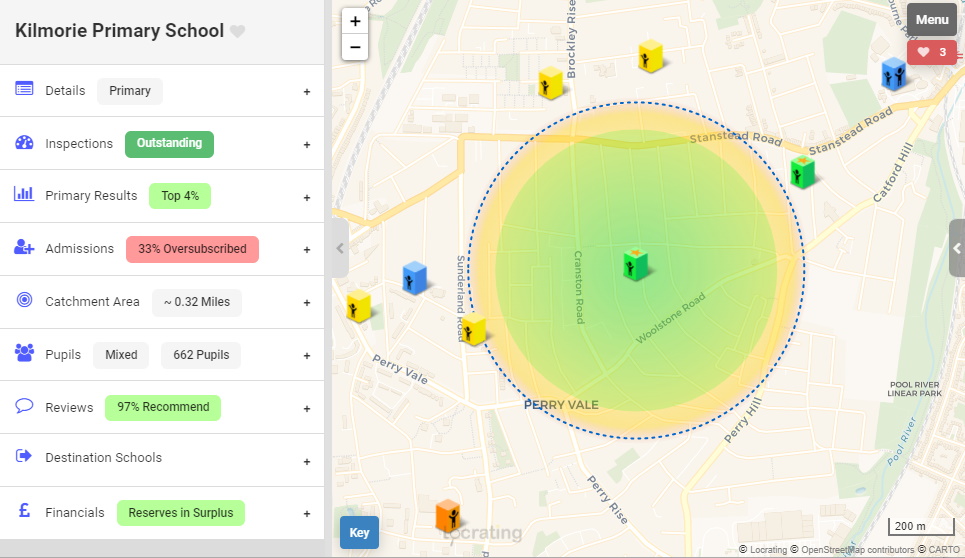
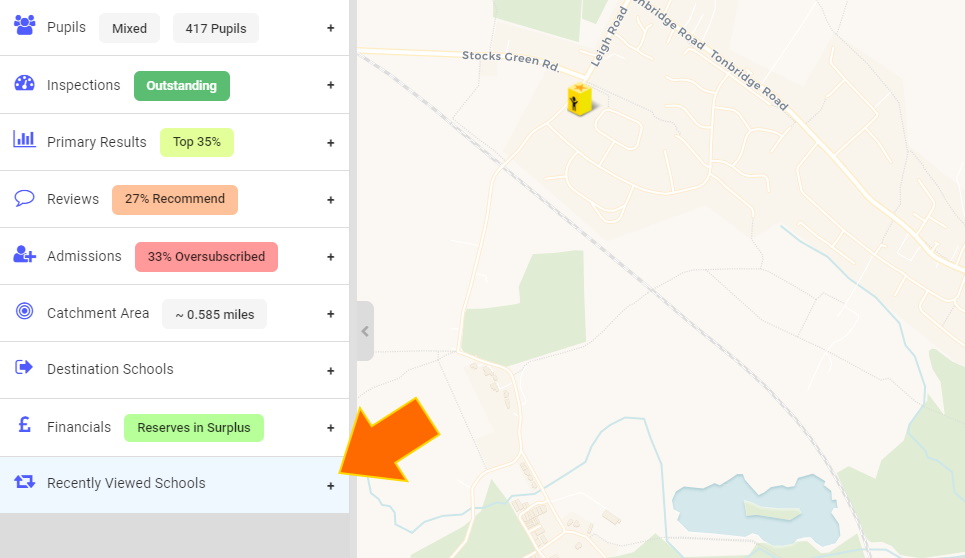
Each section can be expanded to see different information, when collapsed most sections display a key piece of summary information, such as whether the school is oversubscribed and by how much, the approximate catchment area of the school, its exam rankings etc.
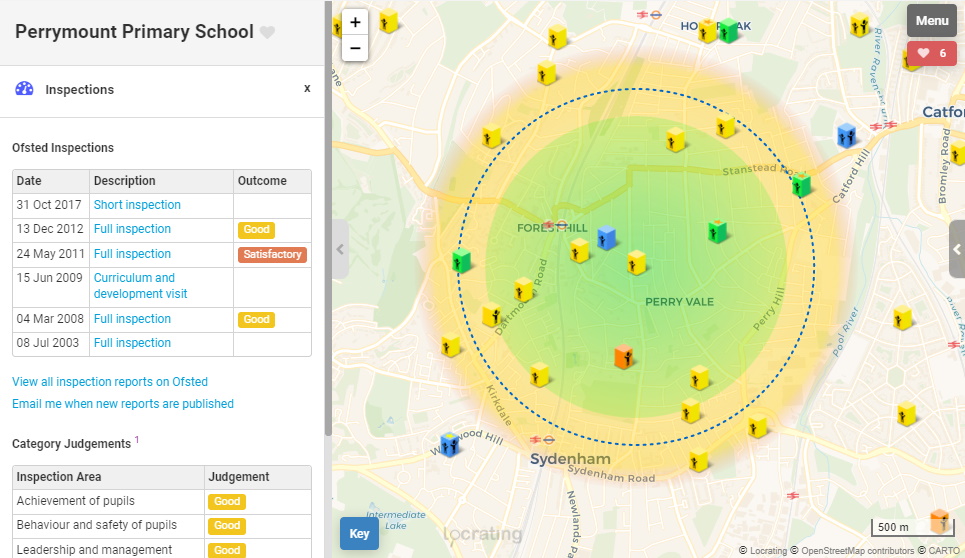
Inspection reports
The inspections tab shows the schools inspections, this means you don't need to open up lots of inspection reports on your screen.
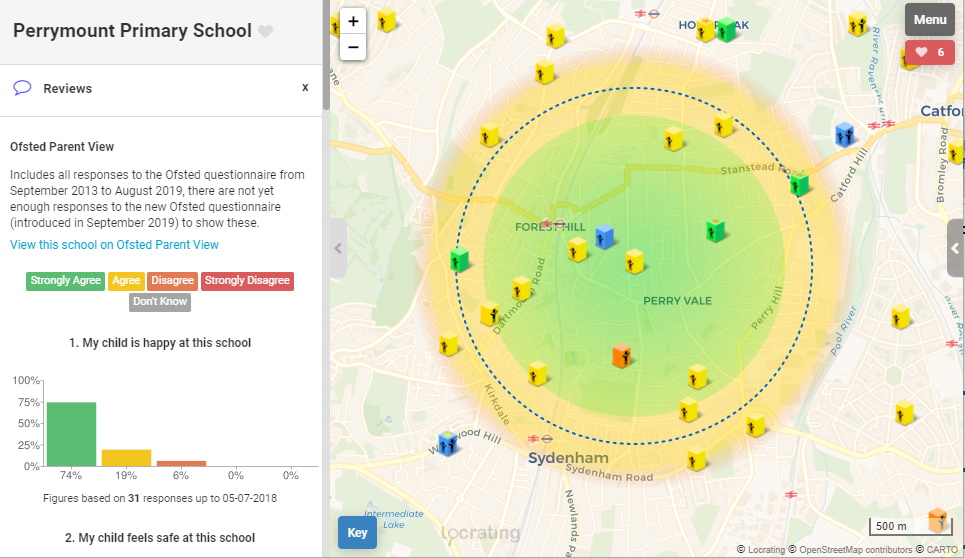
School reviews
The reviews tab shows data from Ofsted Parent View, the only official source of school reviews, used by Ofsted when deciding which school to inspect and when. Ofsted use a questionaire to gather opinions from parents, the results of all these questionaires are shown in this tab.
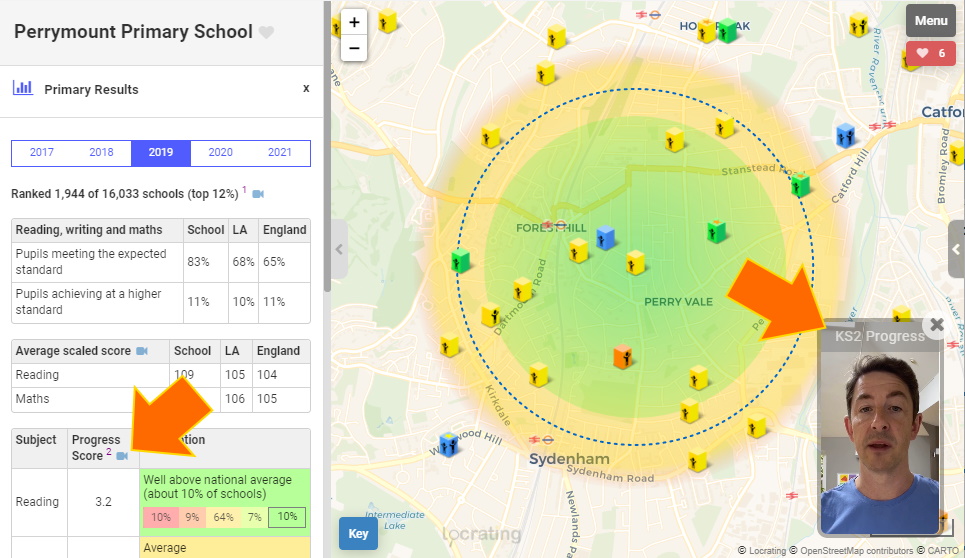
Exam results
The tabs labelled Primary Results, GCSE Results and A-Level Results show exam results for the school. Primary Results shows the results of pupils at Key Stage 2 (SATS tests) and the other tabs shows the results of pupils at Key Stage 4 and 5 (GCSE and A Level). The year of the results is shown under the tab. Each tab also shows the school's ranking against all other schools in that region (e.g. England) based on exam performance.
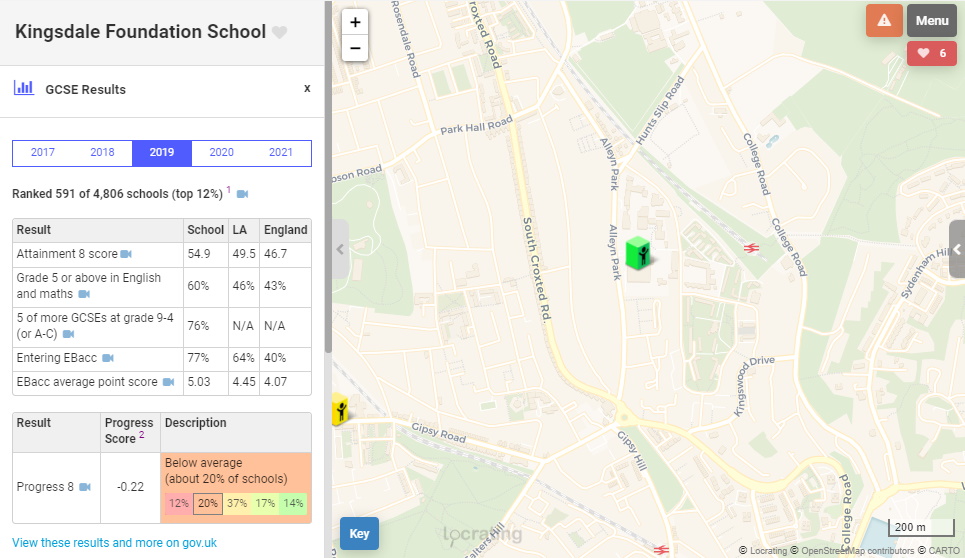
Clicking the blue video icons next to exam measures will launch a video to explain what they mean and how to interpret them.
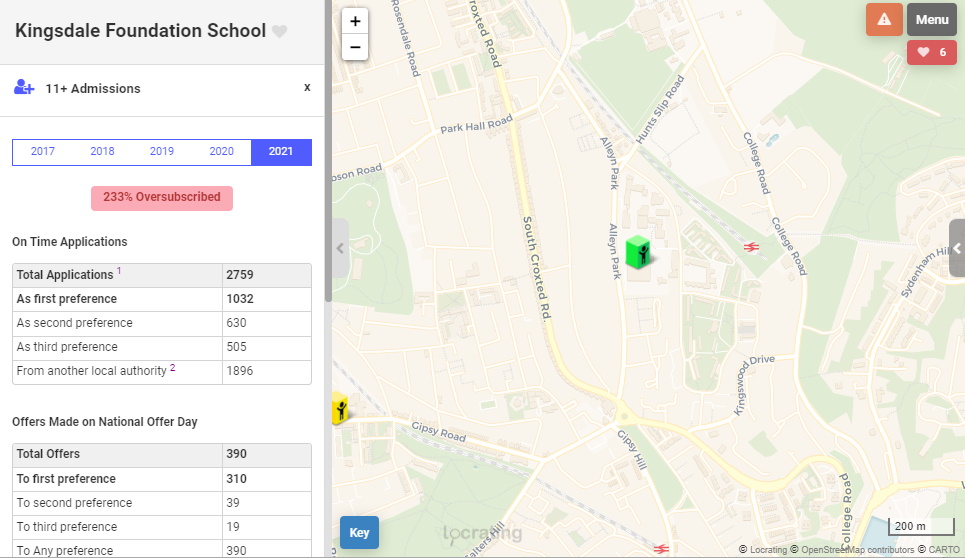
Admissions data
The admissions tab (and 11+ admissions for secondary schools) shows applications and offers to the school, from these we work out how oversubsribed the school is, as detailed in the text under the tables. See Essential things to know when applying for a place at an oversubscribed school.
Last distance offered
Where we have collected last distance offered for the school, this is shown in the tab along with links to the documents where the data has come from, see Collecting last distance offered data.

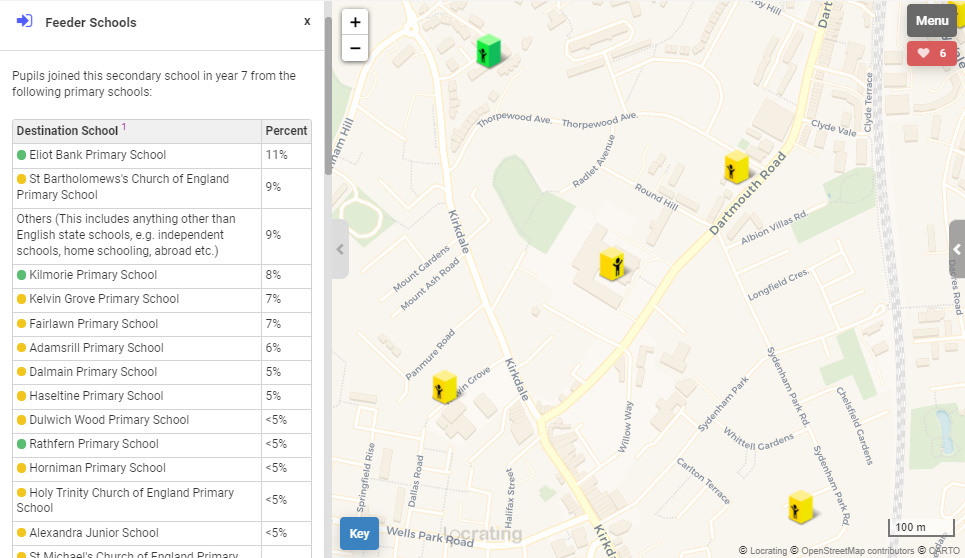
Pupils' movements between schools
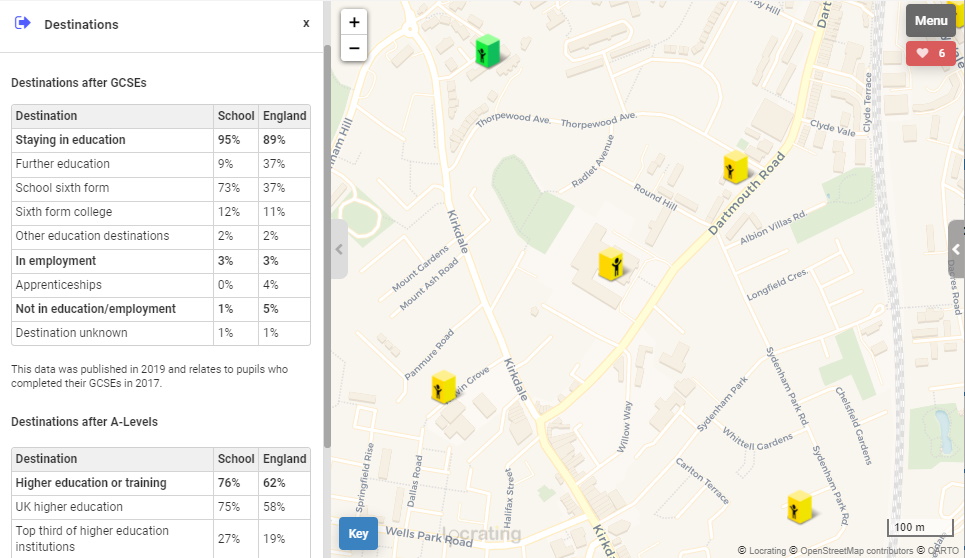
The feeder and destination schools tabs are really interesting. These show where pupils have moved on to (after primary school and GCSEs) and where they have come from (for secondary school and the sixth-form). See School leaver destinations and school joiner origins.
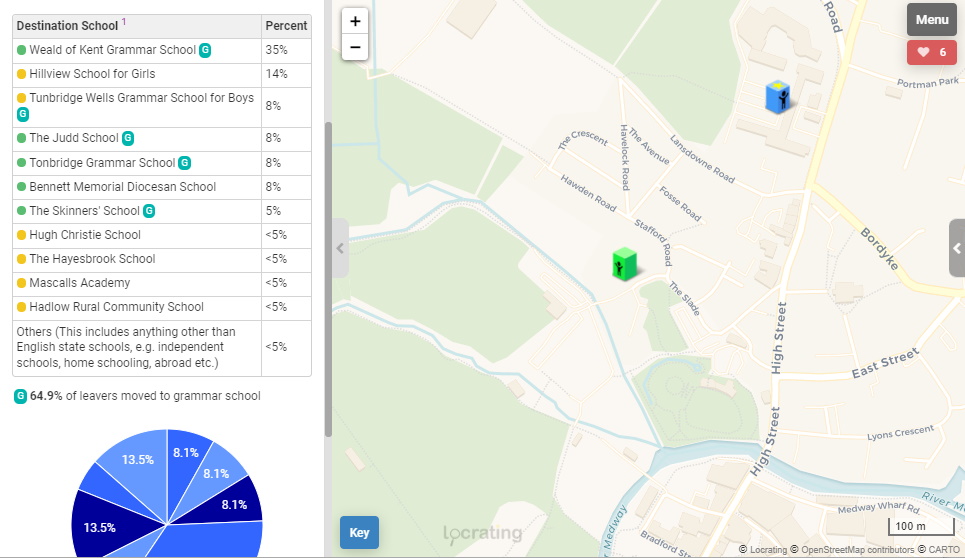
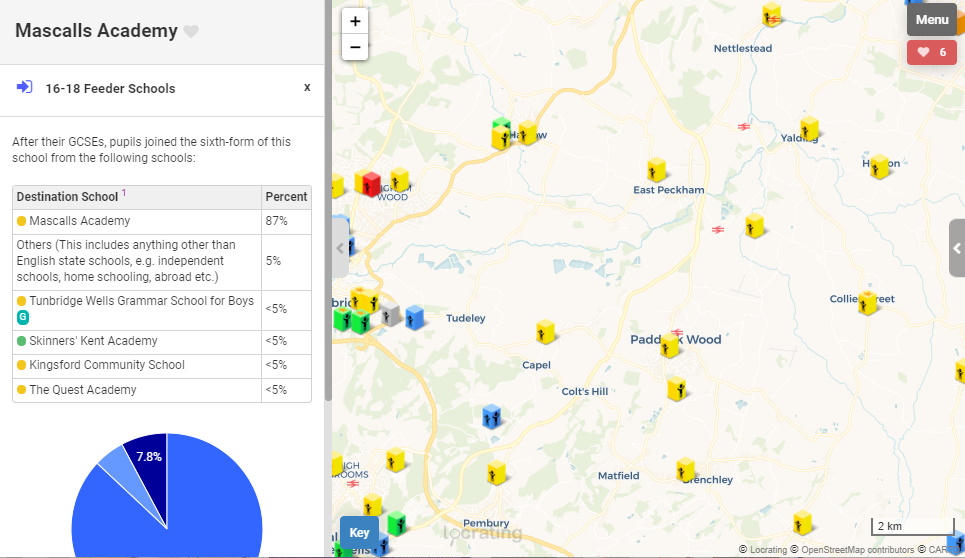
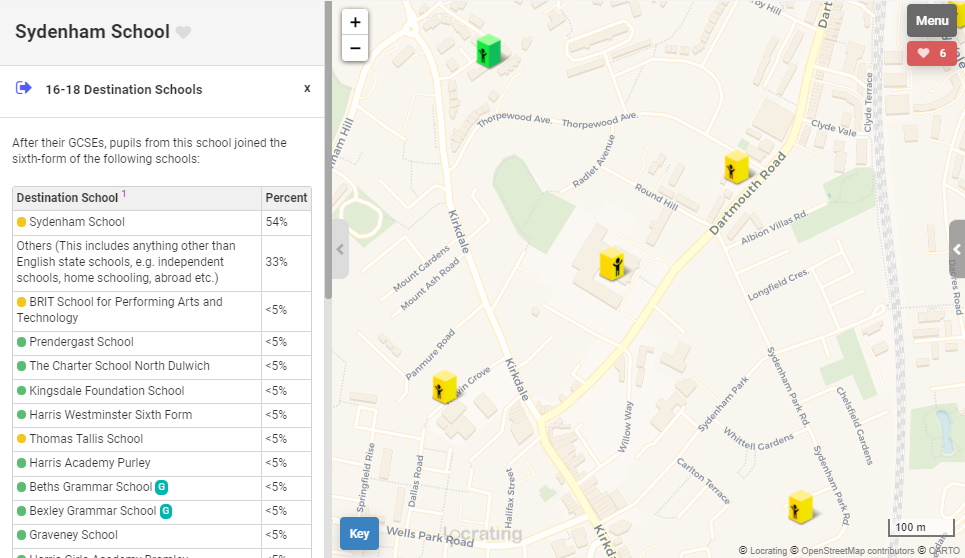
Post school leaver destinations are also available for secondary schools.
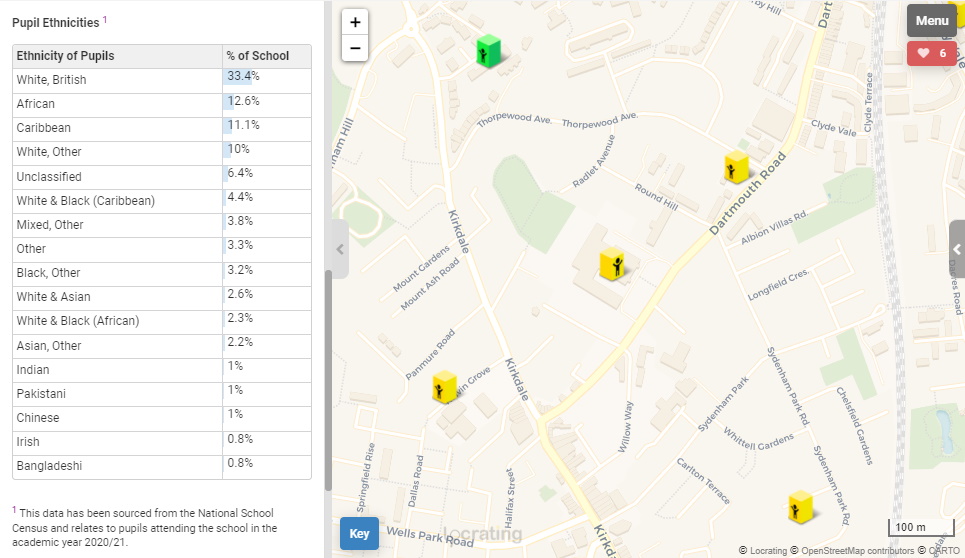
Pupil details, year group sizes and pupil ethnicities
The Pupils tab contains details about pupils, such as the percentage eligible for free school meals. It also shows a breakdown of pupil numbers in each year group and a breakdown of pupil ethnicities; both of which are taken from the most recent school census. The pupil counts are not "live"; to know if spaces are available at a school you need to speak to the school or local authority.

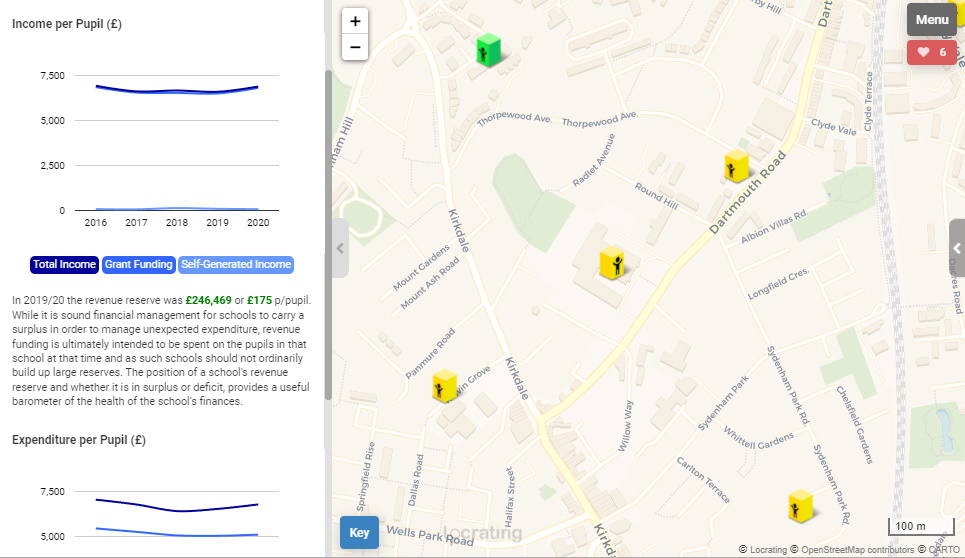
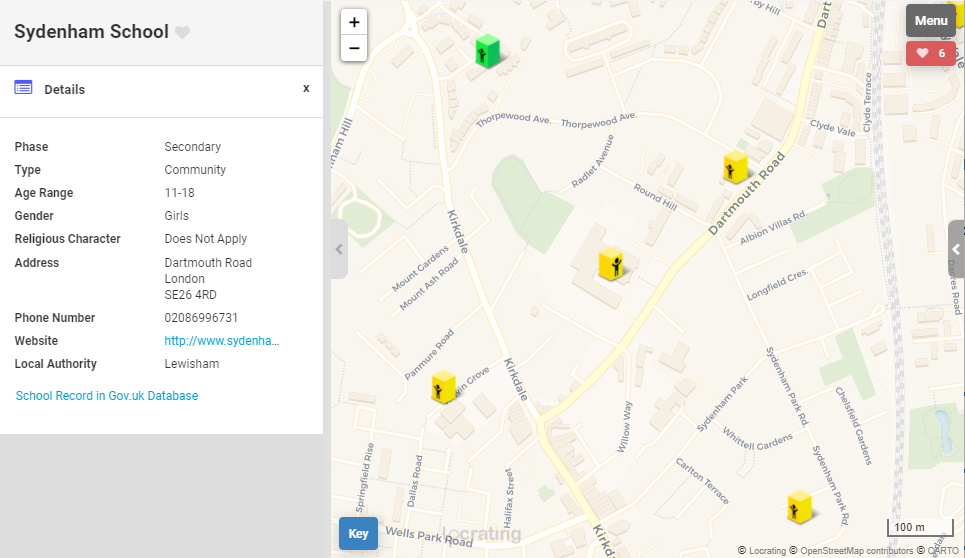
School financials and contact details
Other tabs include financial information and contact details (including the school's website).
Recently viewed schools
To assist with navigation between schools, we store recently viewed schools in a browser cookie; this makes it quick and easy to naviagte back and forth between different schools. If you want to remember particular schools between different devices and/or compare them side by side, you should add them to your shortlist.
Catchment indicators
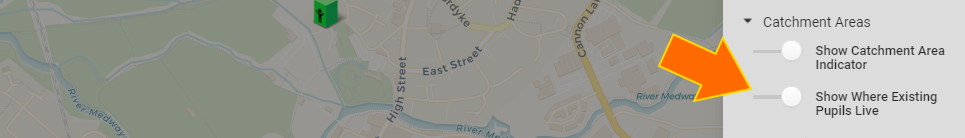
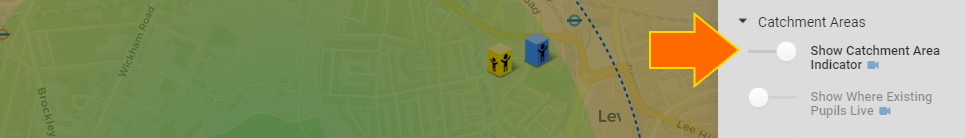
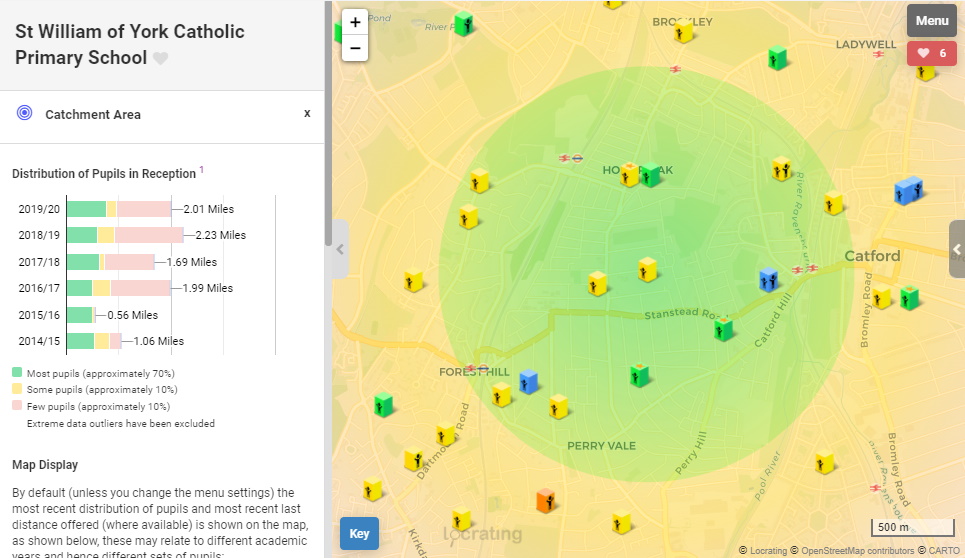
When you click on a school there are three types of catchment information that can be displayed: our catchment areas indicators, where existing children live and last distance offered. To see our catchment indicators and last distance offered you must turn on the option Show catchment area indicator
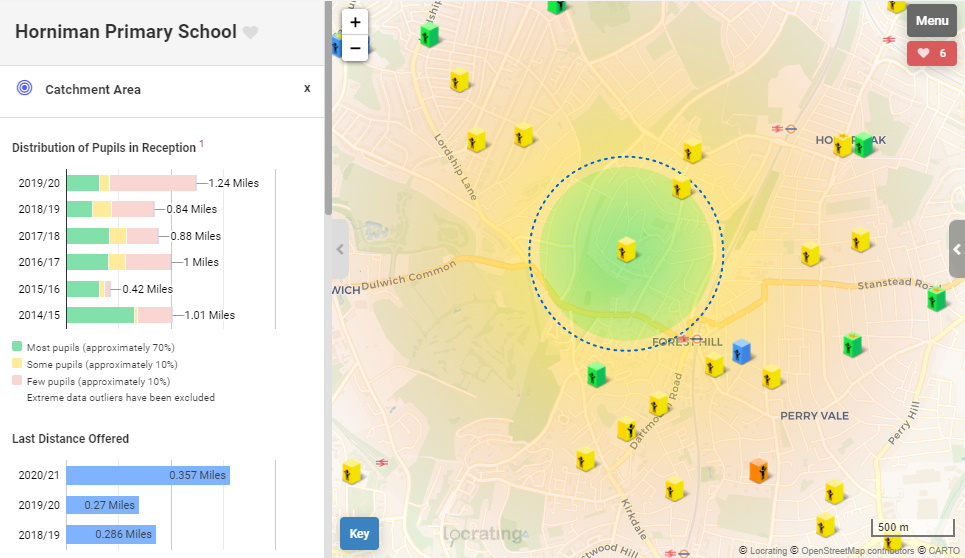
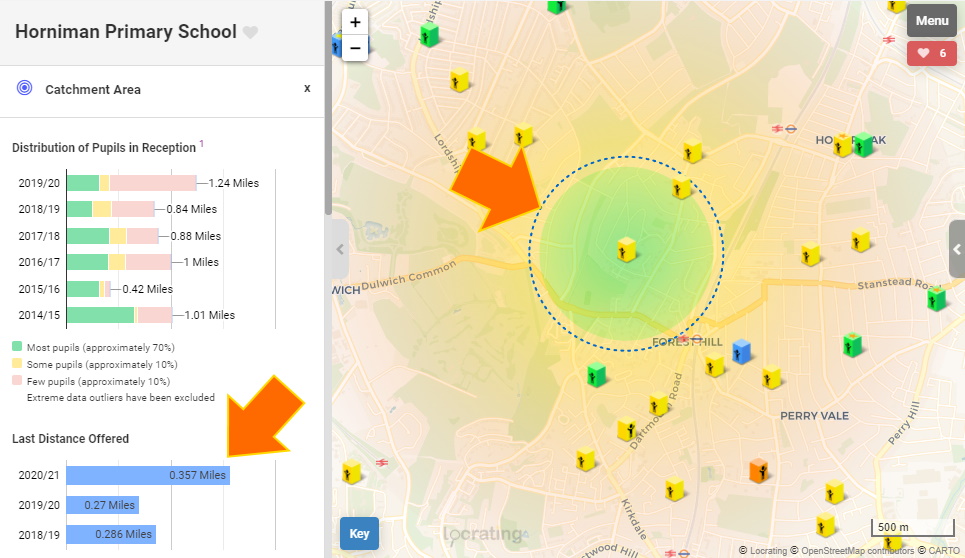
When you click a school you will then be shown both our catchment area indicators (shaded green/yellow/red circles) and last distance offered (dotted blue lines). Historical values for both are shown in the popup under the Catchment Area tab.
Last distance offered data is also displayed in each school's "Admissions" tab, along with links to where the data was sourced from.
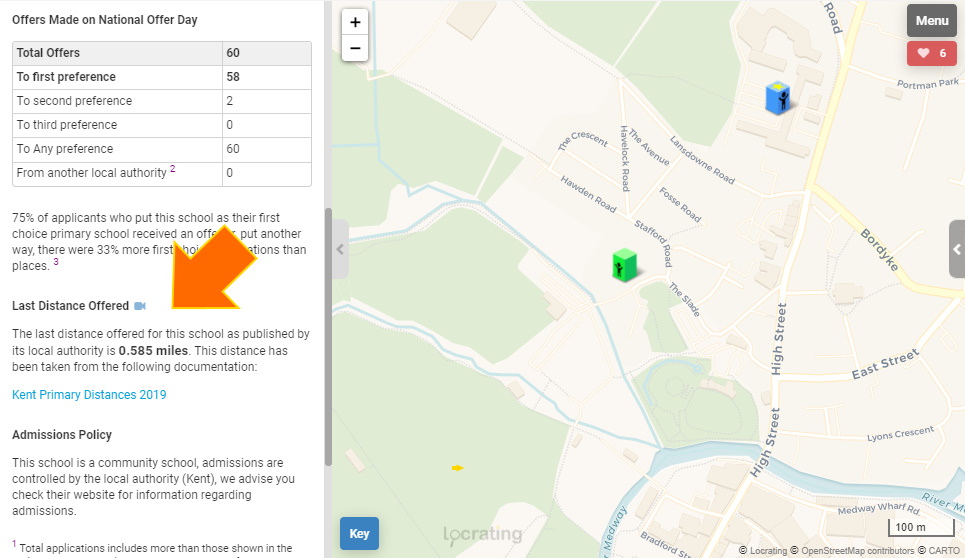
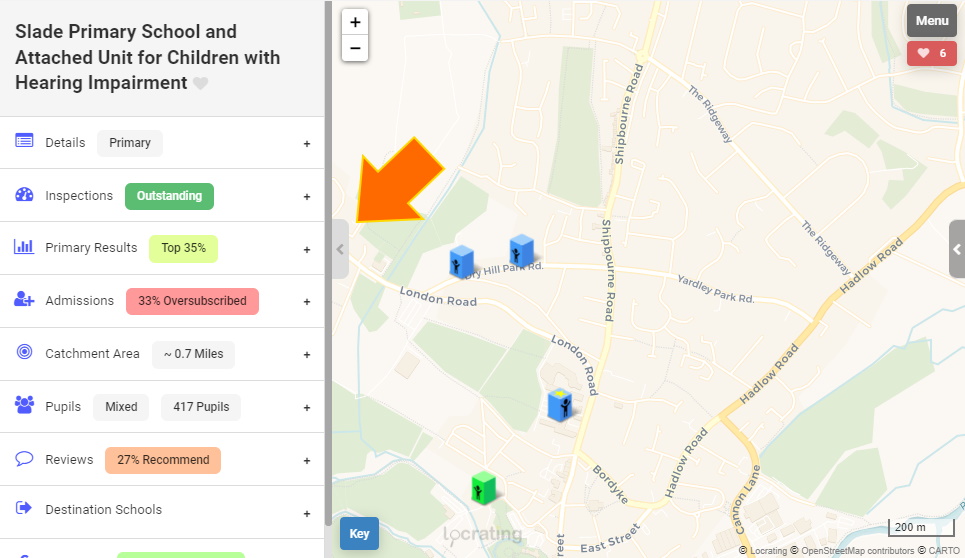
Unfortunately, last distance offered data is not available for all schools as it needs to be manually collected and we can't do that for 50,000+ schools. Where it is not available the school will appear as below (i.e. no blue charts, blue dotted line or distances in 'Admissions' tab):
For more information see:
Locrating's catchment areas explained
Comparing Locrating catchment indicators with council cut off distances
Collecting last distance offered data
Catchment area myths
Essential things to know when applying for a place at an oversubscribed school
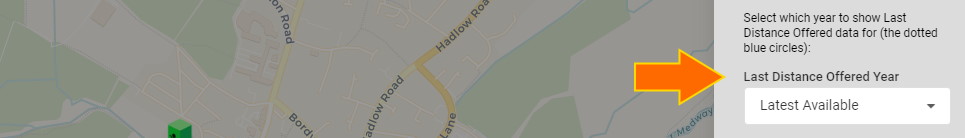
For last distance offered, you can change which year's data is drawn on the map.
For our catchment area indicators you can change both which year's data is drawn on the map as well as which year group of children are included.
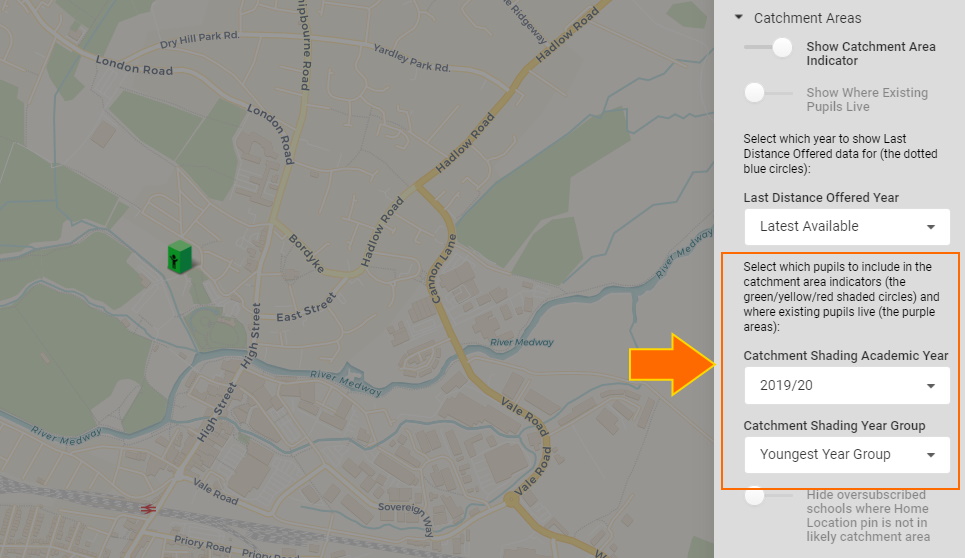
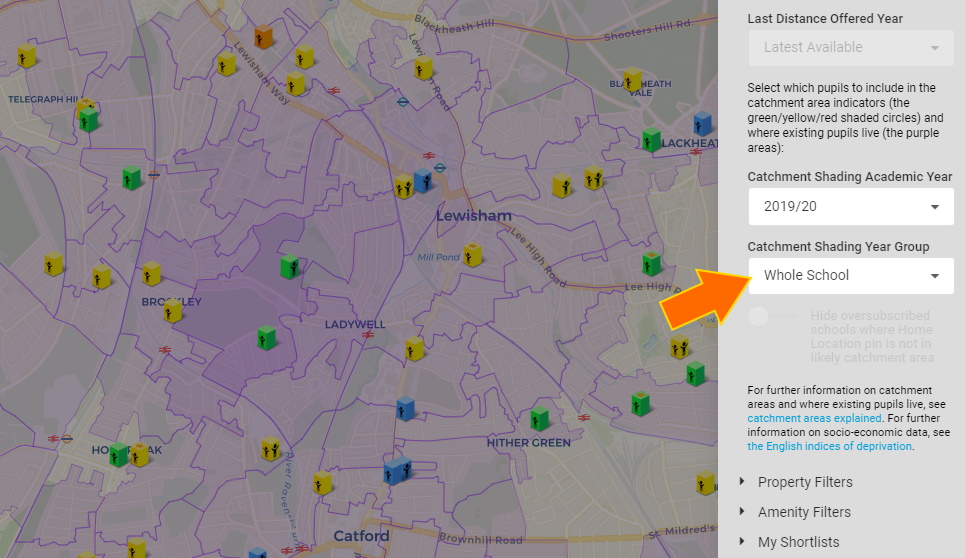
To see where existing children live you must turn on the Show where existing children live option. When you click on a school you wull then be shown where exiting children live; these are the same children as included in the catchment area indicator above.
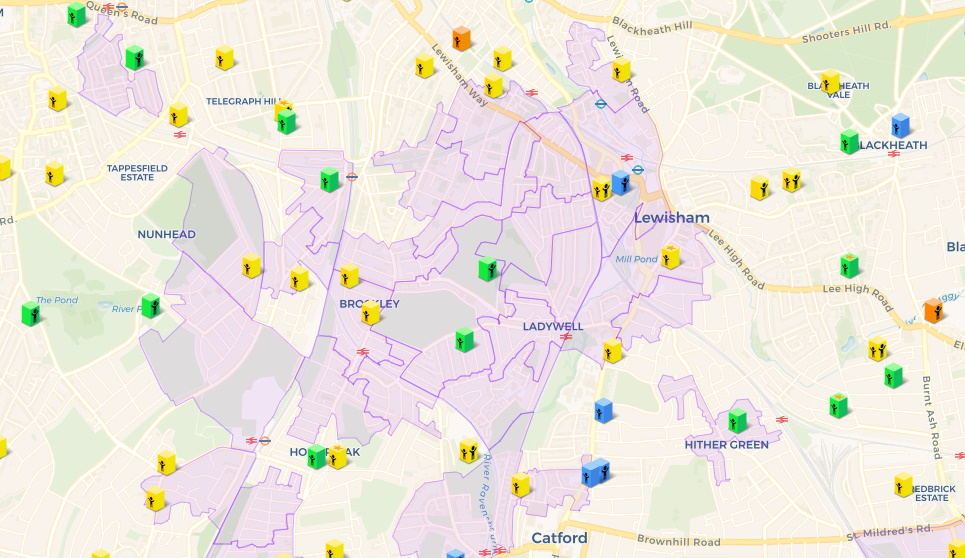
Again, you can change both which year's data is drawn on the map as well as which year group of children are included (using the same settings as above).
When showing areas there is no information on the number of pupils in each area, but if you select "Whole School" in the year group selector, the areas will be shaded to indicate the number of children in each area; the darker the area the more children.
Independent schools
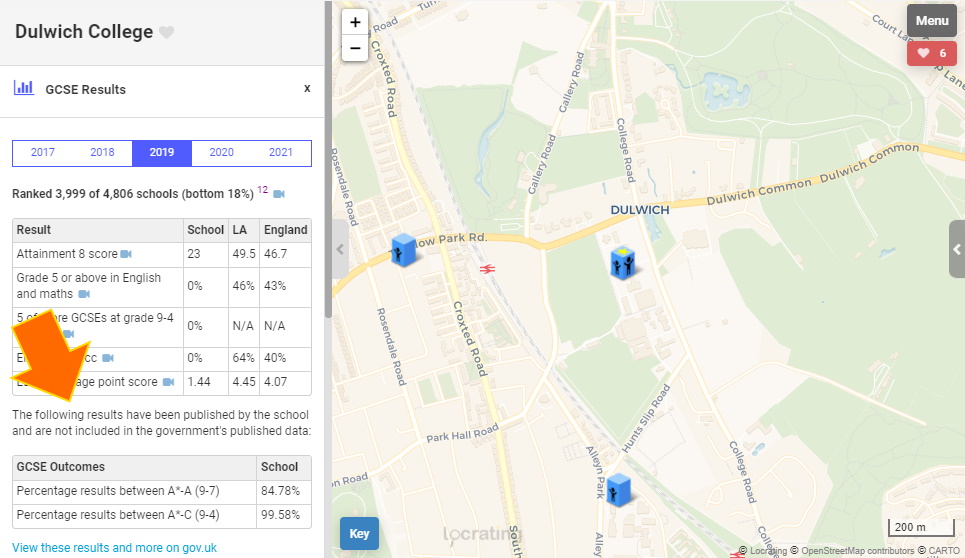
You can choose to show or hide independent schools via the schools filters. It should be noted that independent (private) primary schools (aka prep schools) don't take the Key Stage 2 SATS and so there is simply no way to directly compare the performance of these schools with either each other, or state primary schools.
Also, GCSE results for independent schools are mostly meaningless as they most often use the international GCSEs (iGCSEs), which are assigned no points in the government's data, so it appears like they are poor performers, when they are often the opposite. We've included data (where available) from other sources, that allows the comparison of independent schools at GCSE level with each other.
Getting help
If you're having issues or not understanding something please always feel free to reach out for help; we're here 7 days a week. We can help explain the data and how to use the site, but please note e cannot give personal advice, such as which school is "better"; these are personal decisions based on your own priorities and we are not qualified to give this advice. We also can't provide any guarantees to school entry, such as where to live to ensure success; these things are inherently unpredictable.
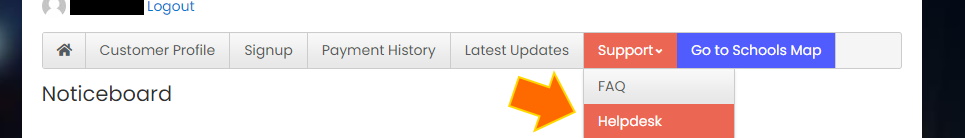
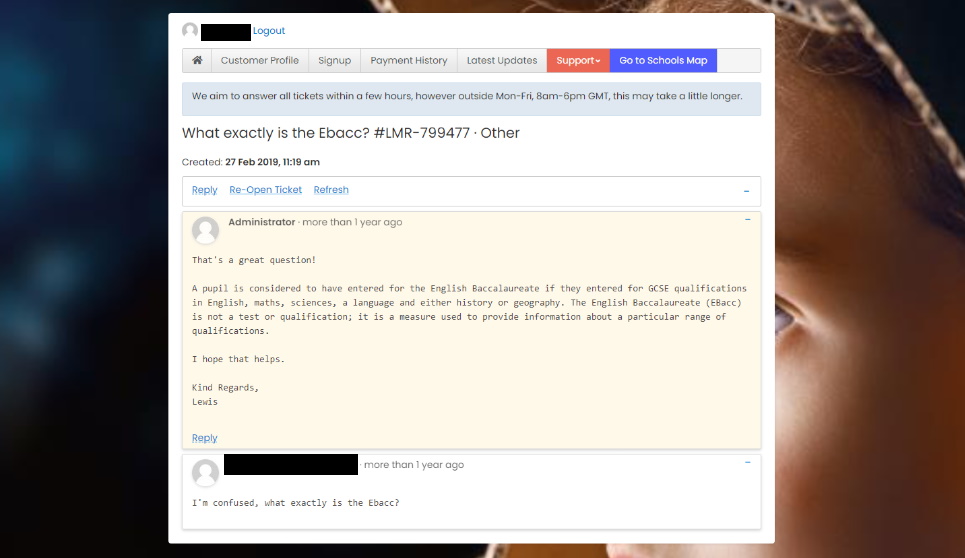
The best way to get help is via our helpdesk. To do this, logon and then select the Helpdesk menu option and then click Submit New Ticket.
When we reply you will receive an email notifying you that there is a new comment against the ticket. You must click the link in the email, to return to the ticket, to view our reply. Or you can go back into the ticket from your dashboard and check for a response.
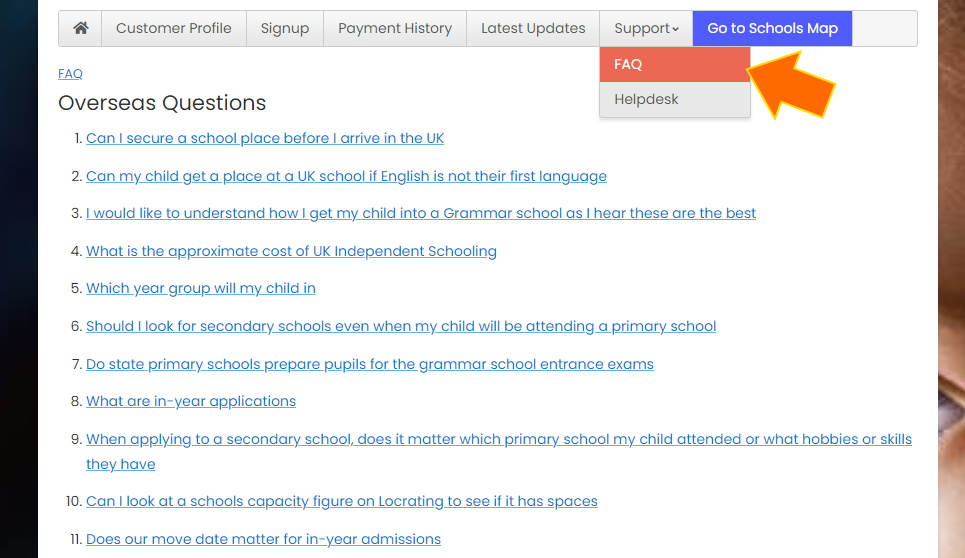
We also have a comprehensive Frequently Asked Questions section to our website which you can access from your dashboard.
We'll keep updating this blog post over time to keep it accurate.
Author: Lewis Tandy
